DIPAAL API result samples
This is a small sample of the results DIPAAL is capable of producing. The API specification can be found on https://dipaal.dk
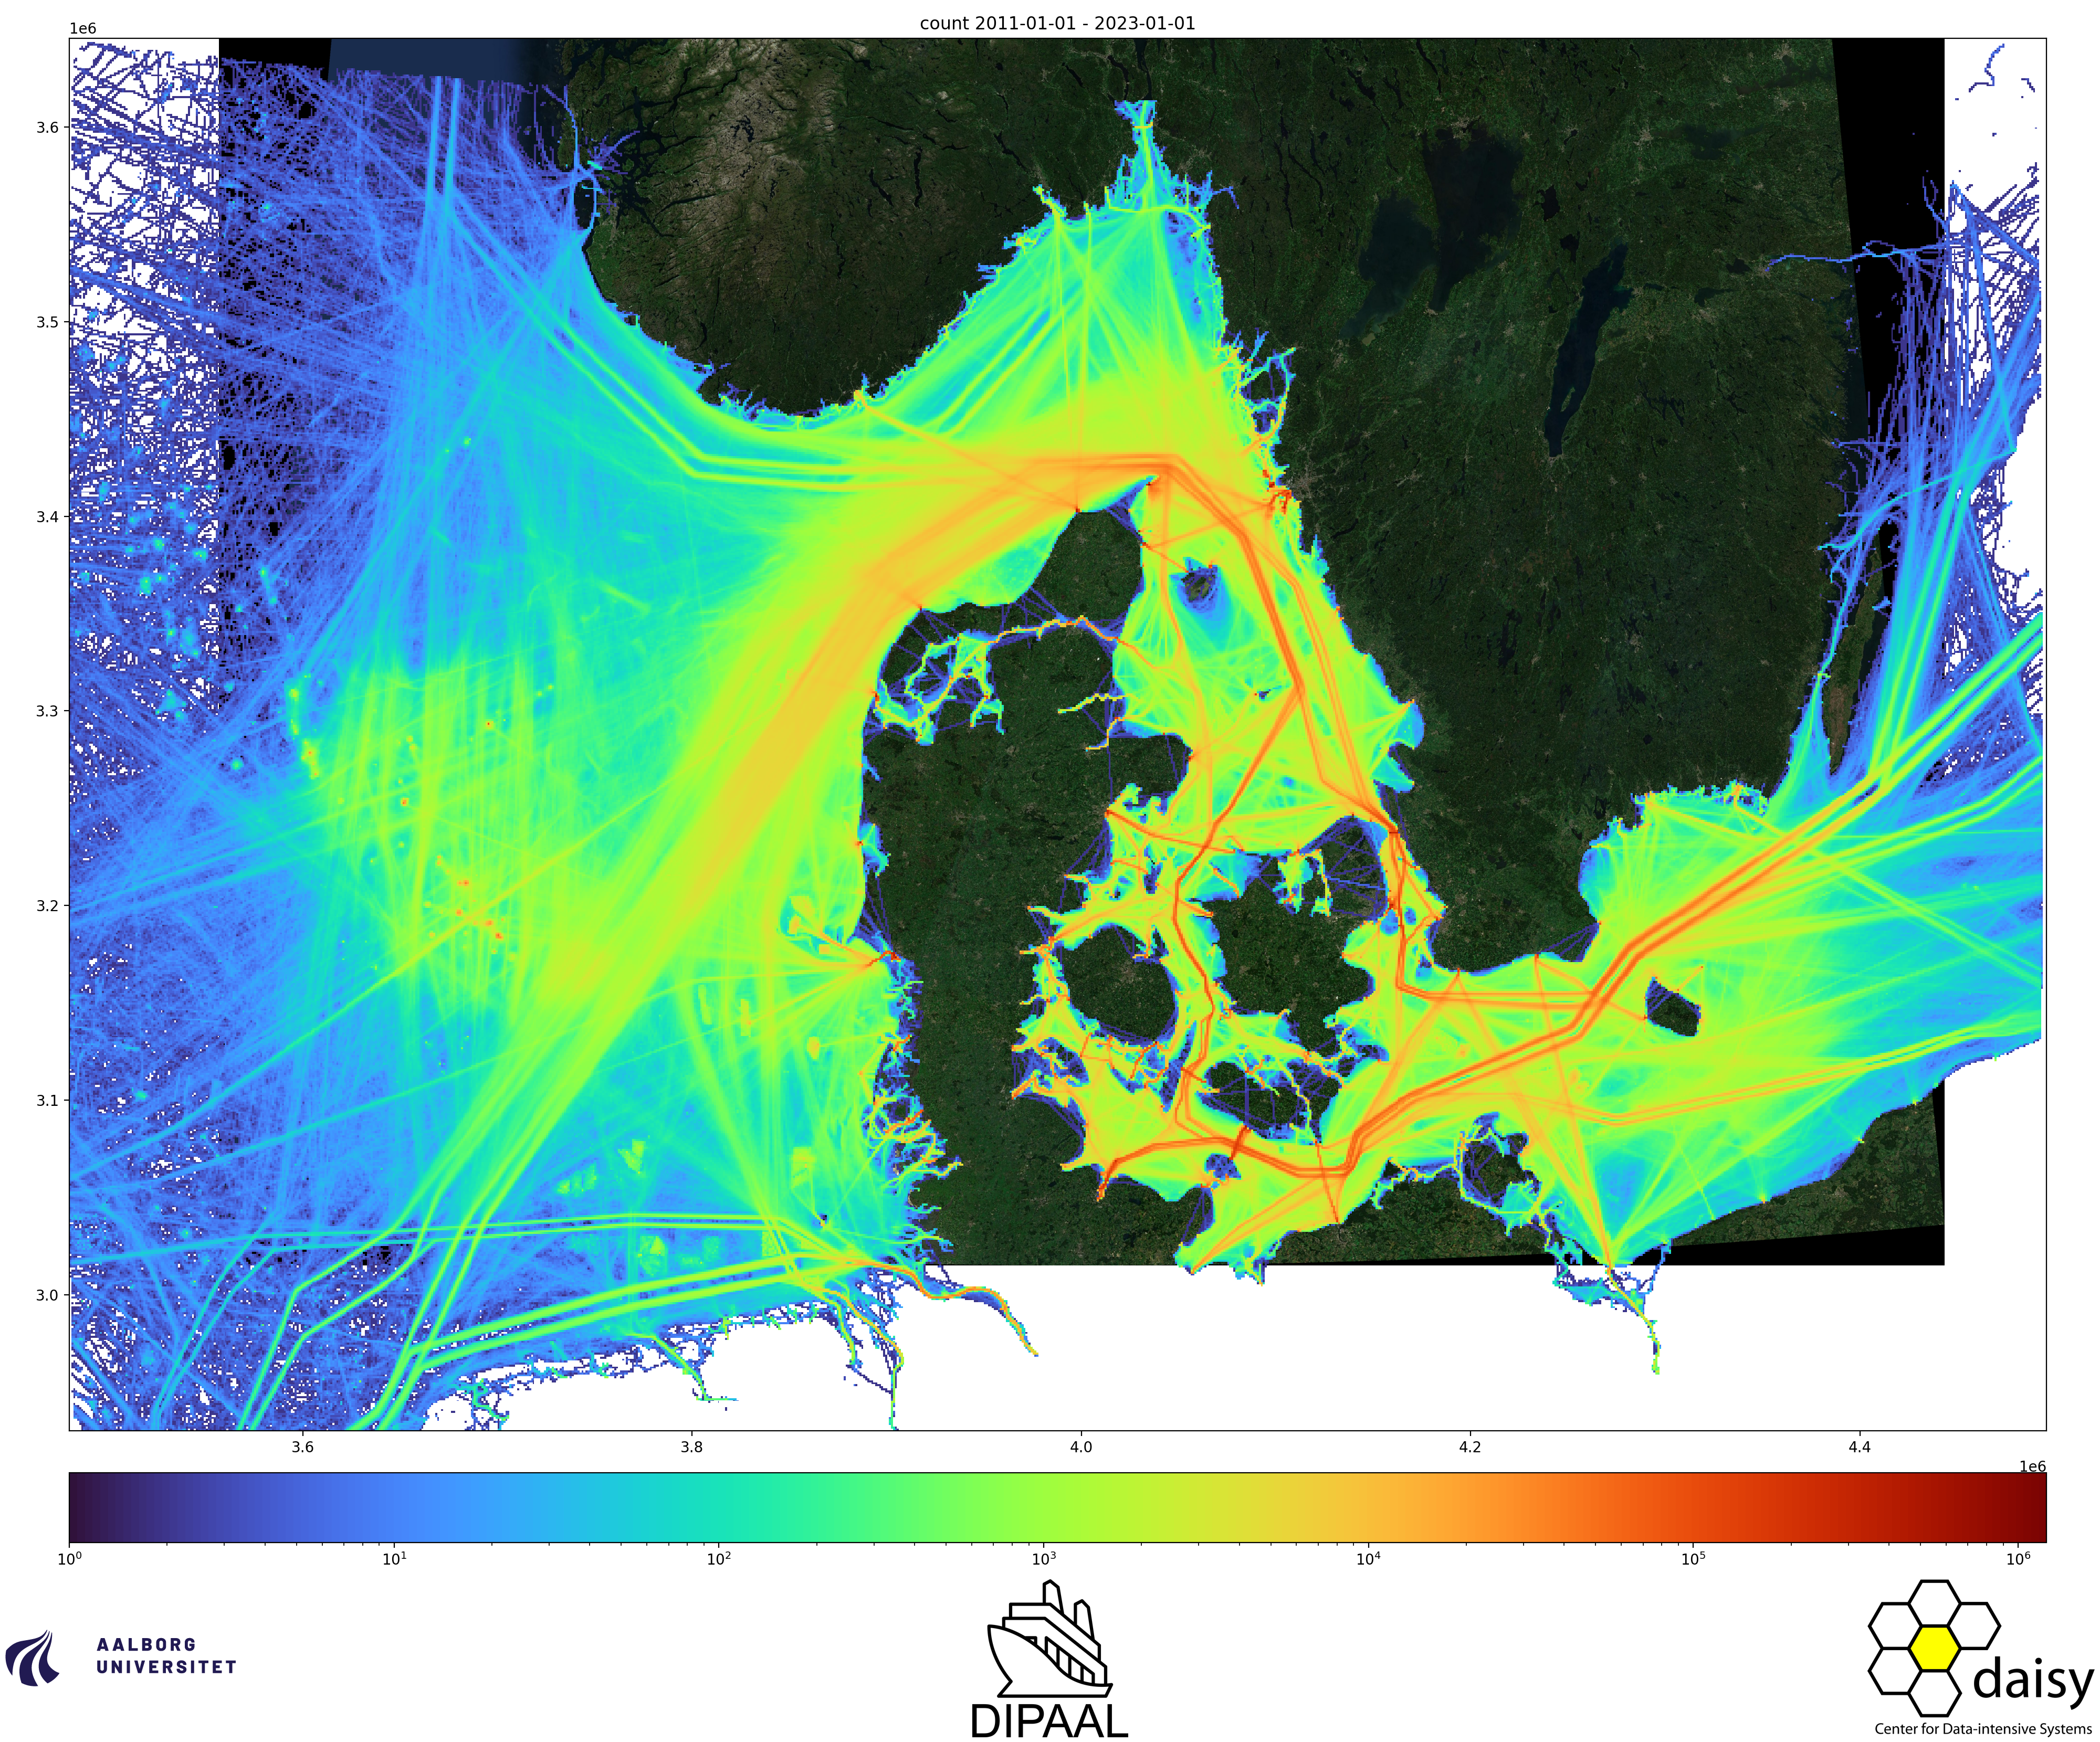
5 year heatmaps all ships
All shown 5 year heatmaps are in 1000m resolution. It takes ~30 seconds to render from request start.
Count heatmap
Unit is number of occurences.
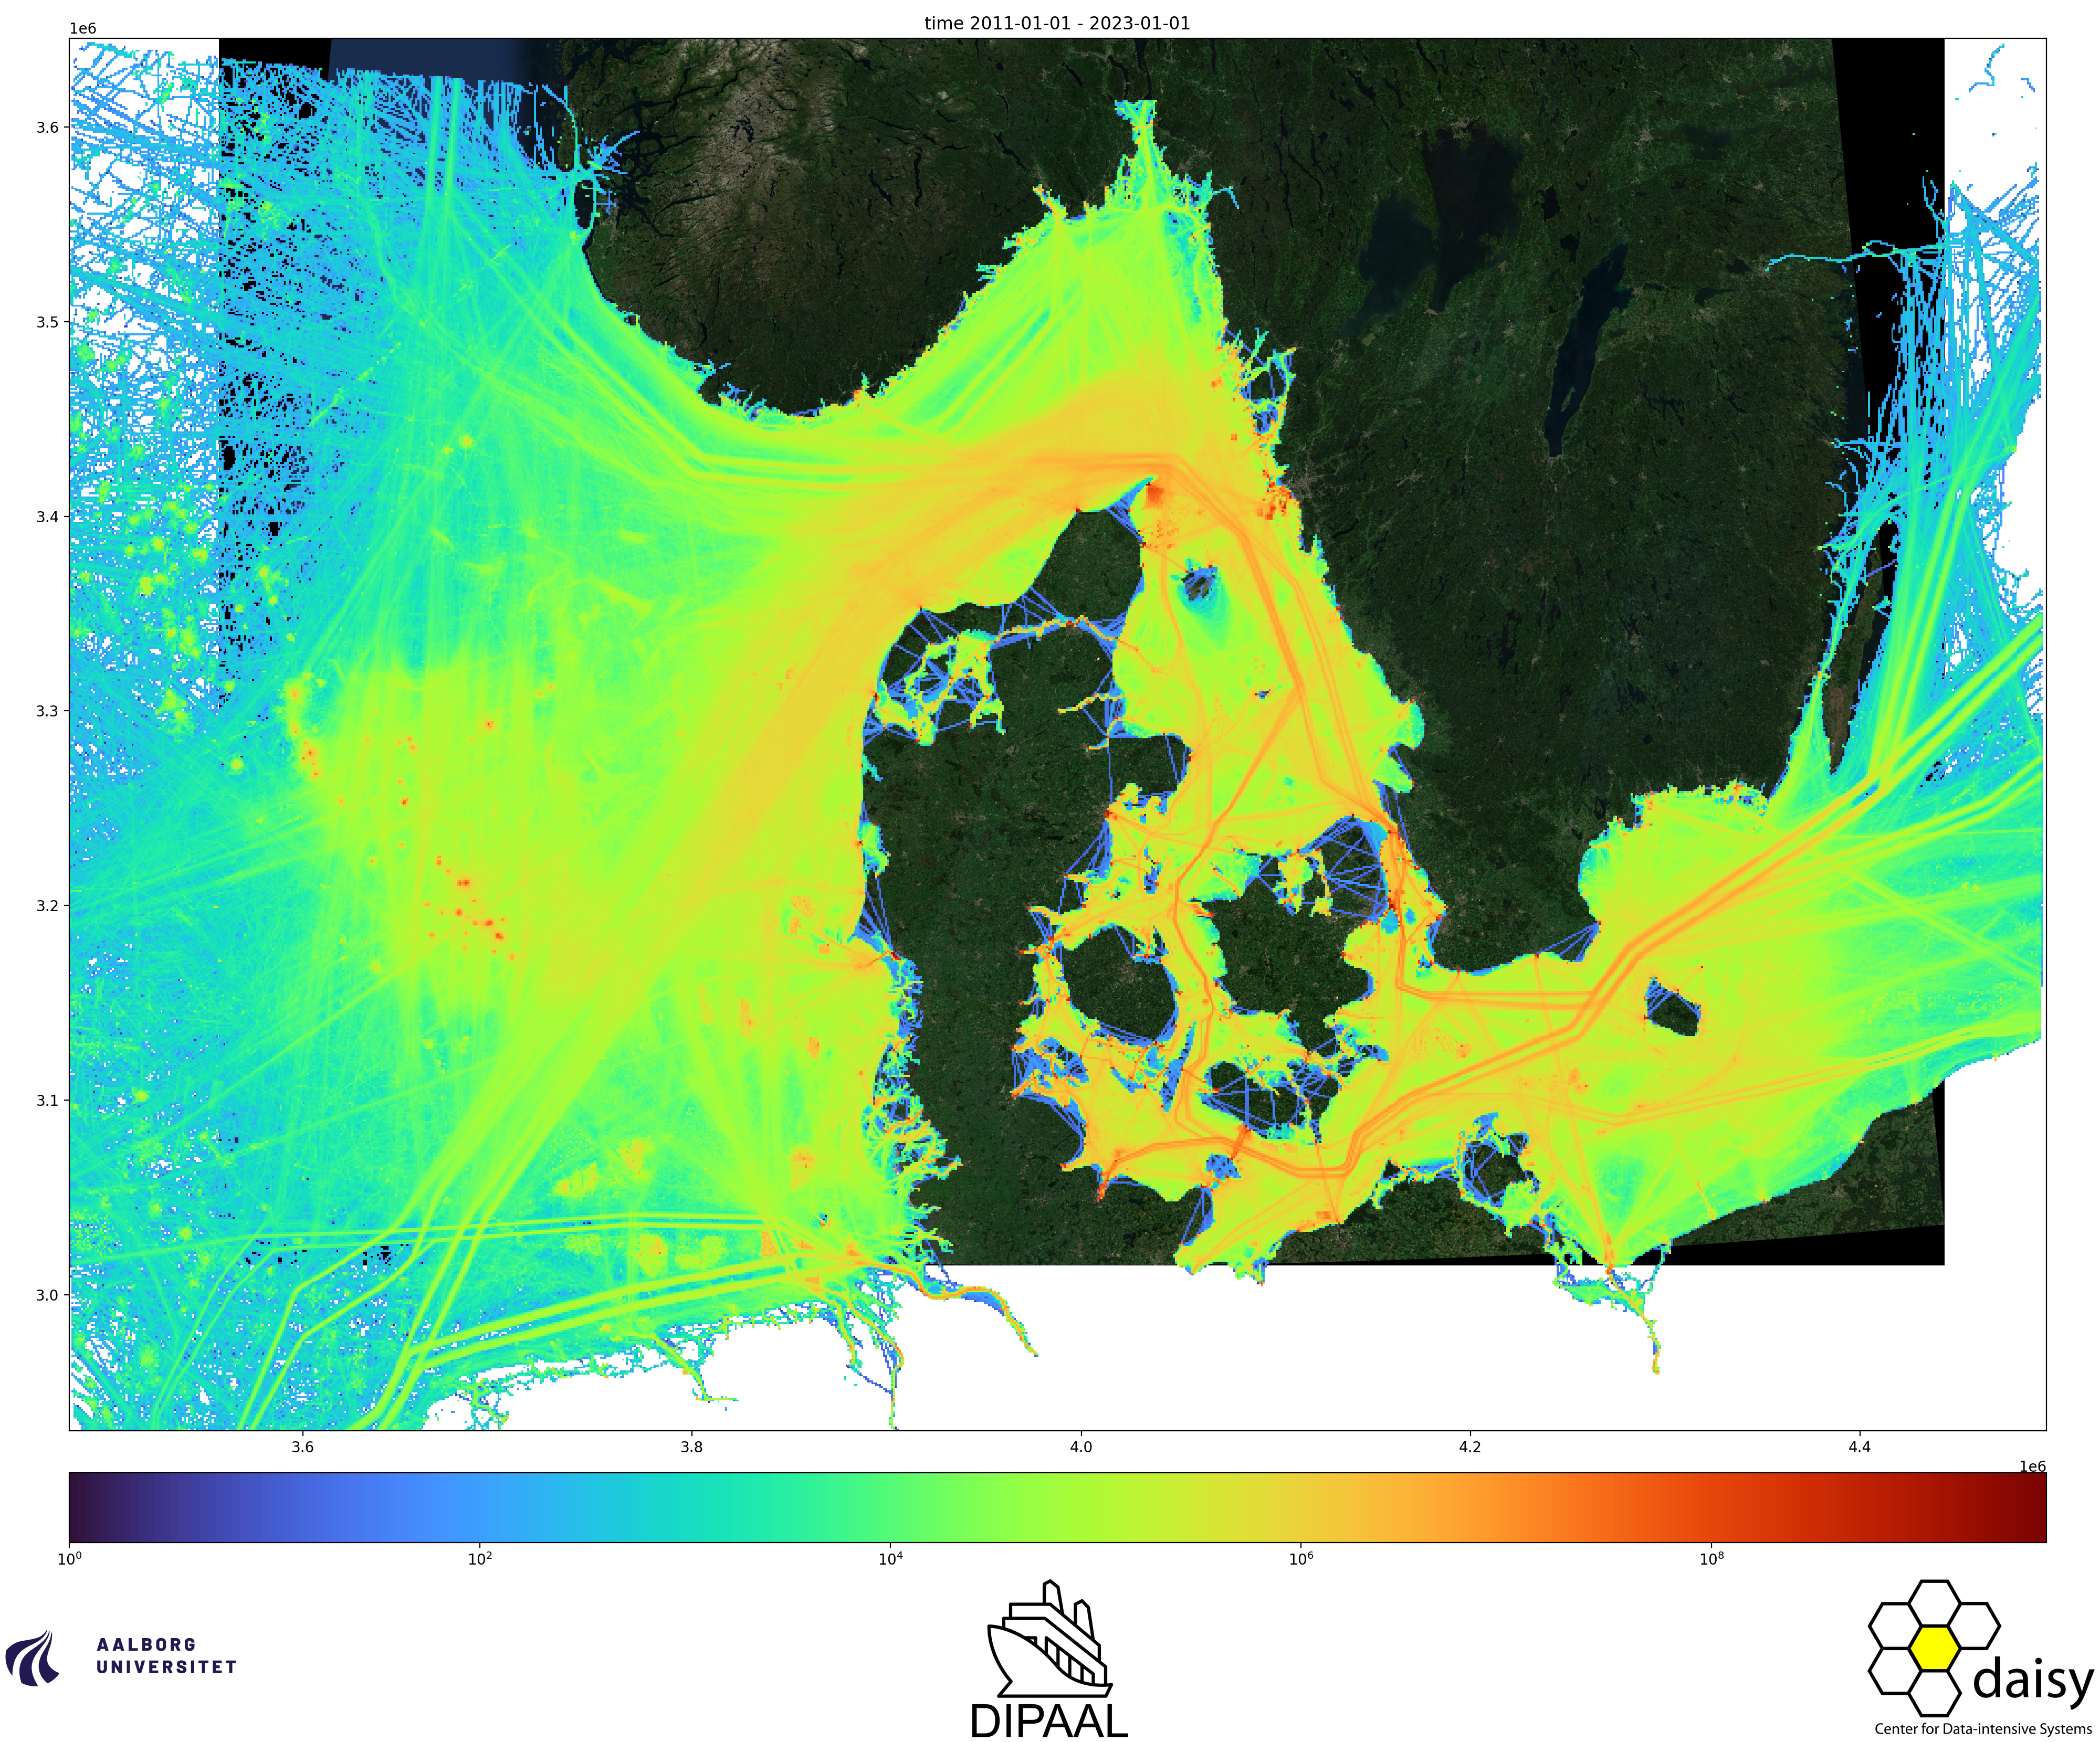
Time heatmap
Unit is sum of time spent in the cell in seconds.
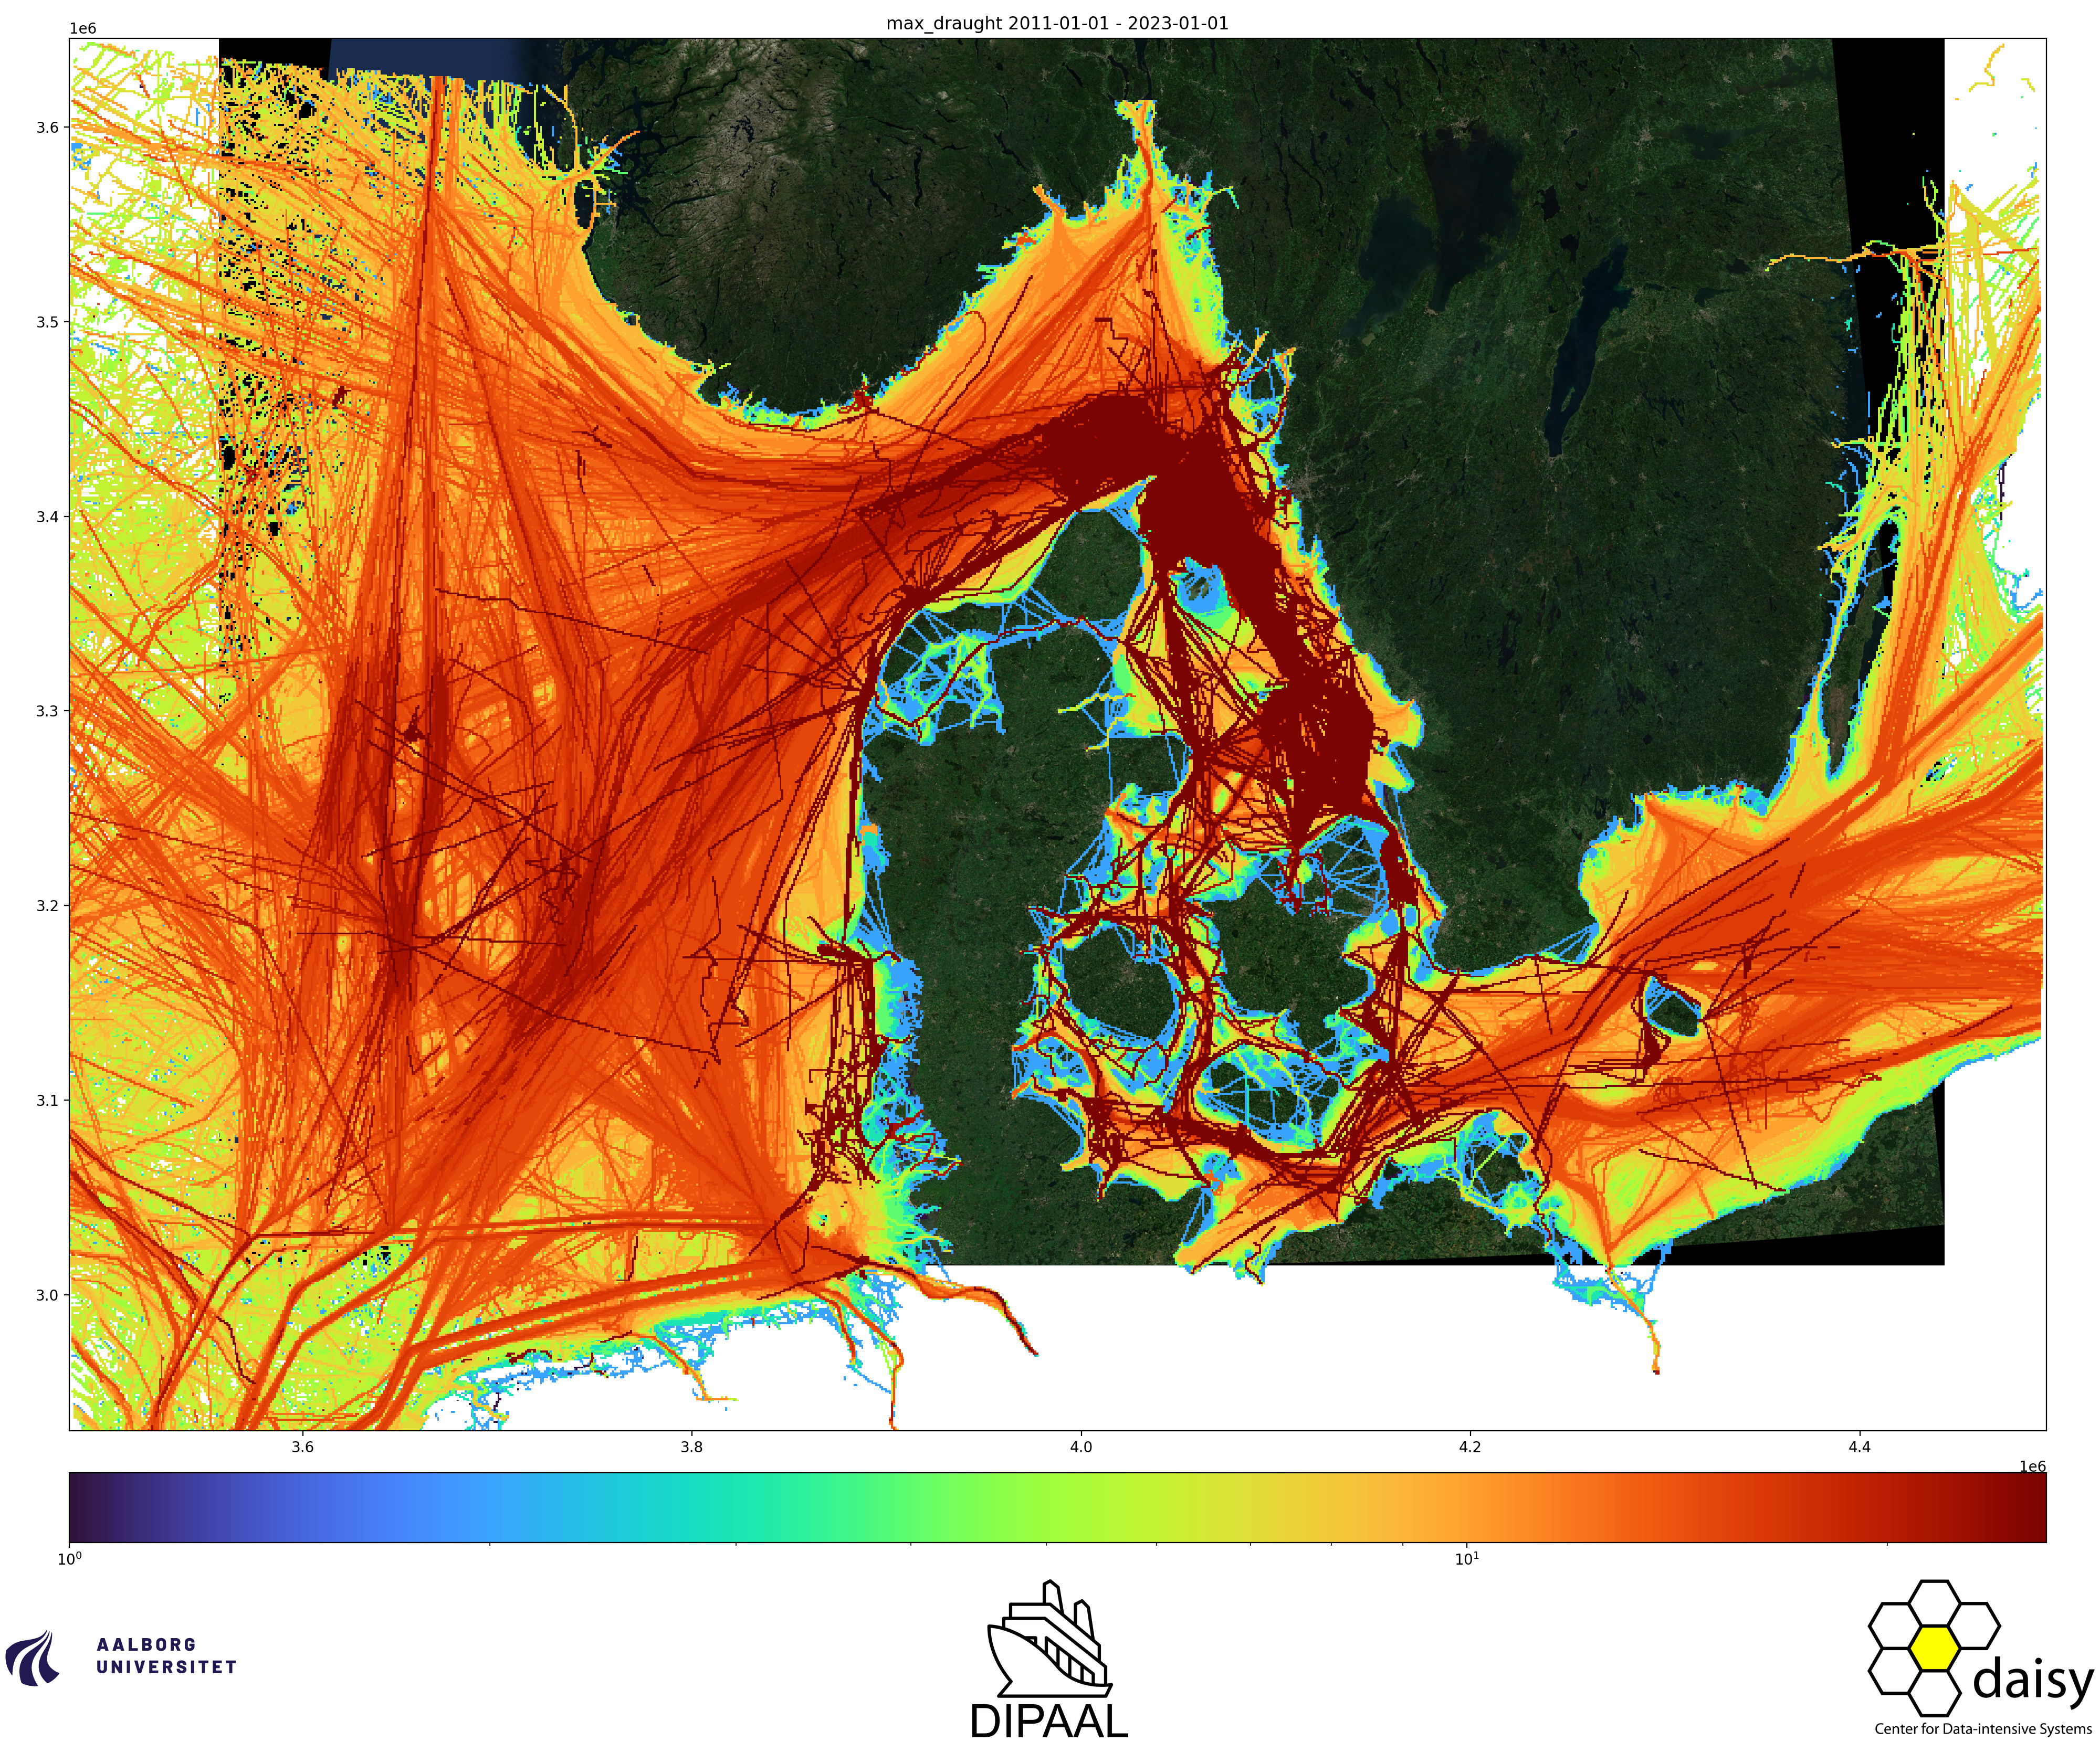
Maximum Draught Heatmap
Unit is the maximum observed draught observed in a cell in meters.
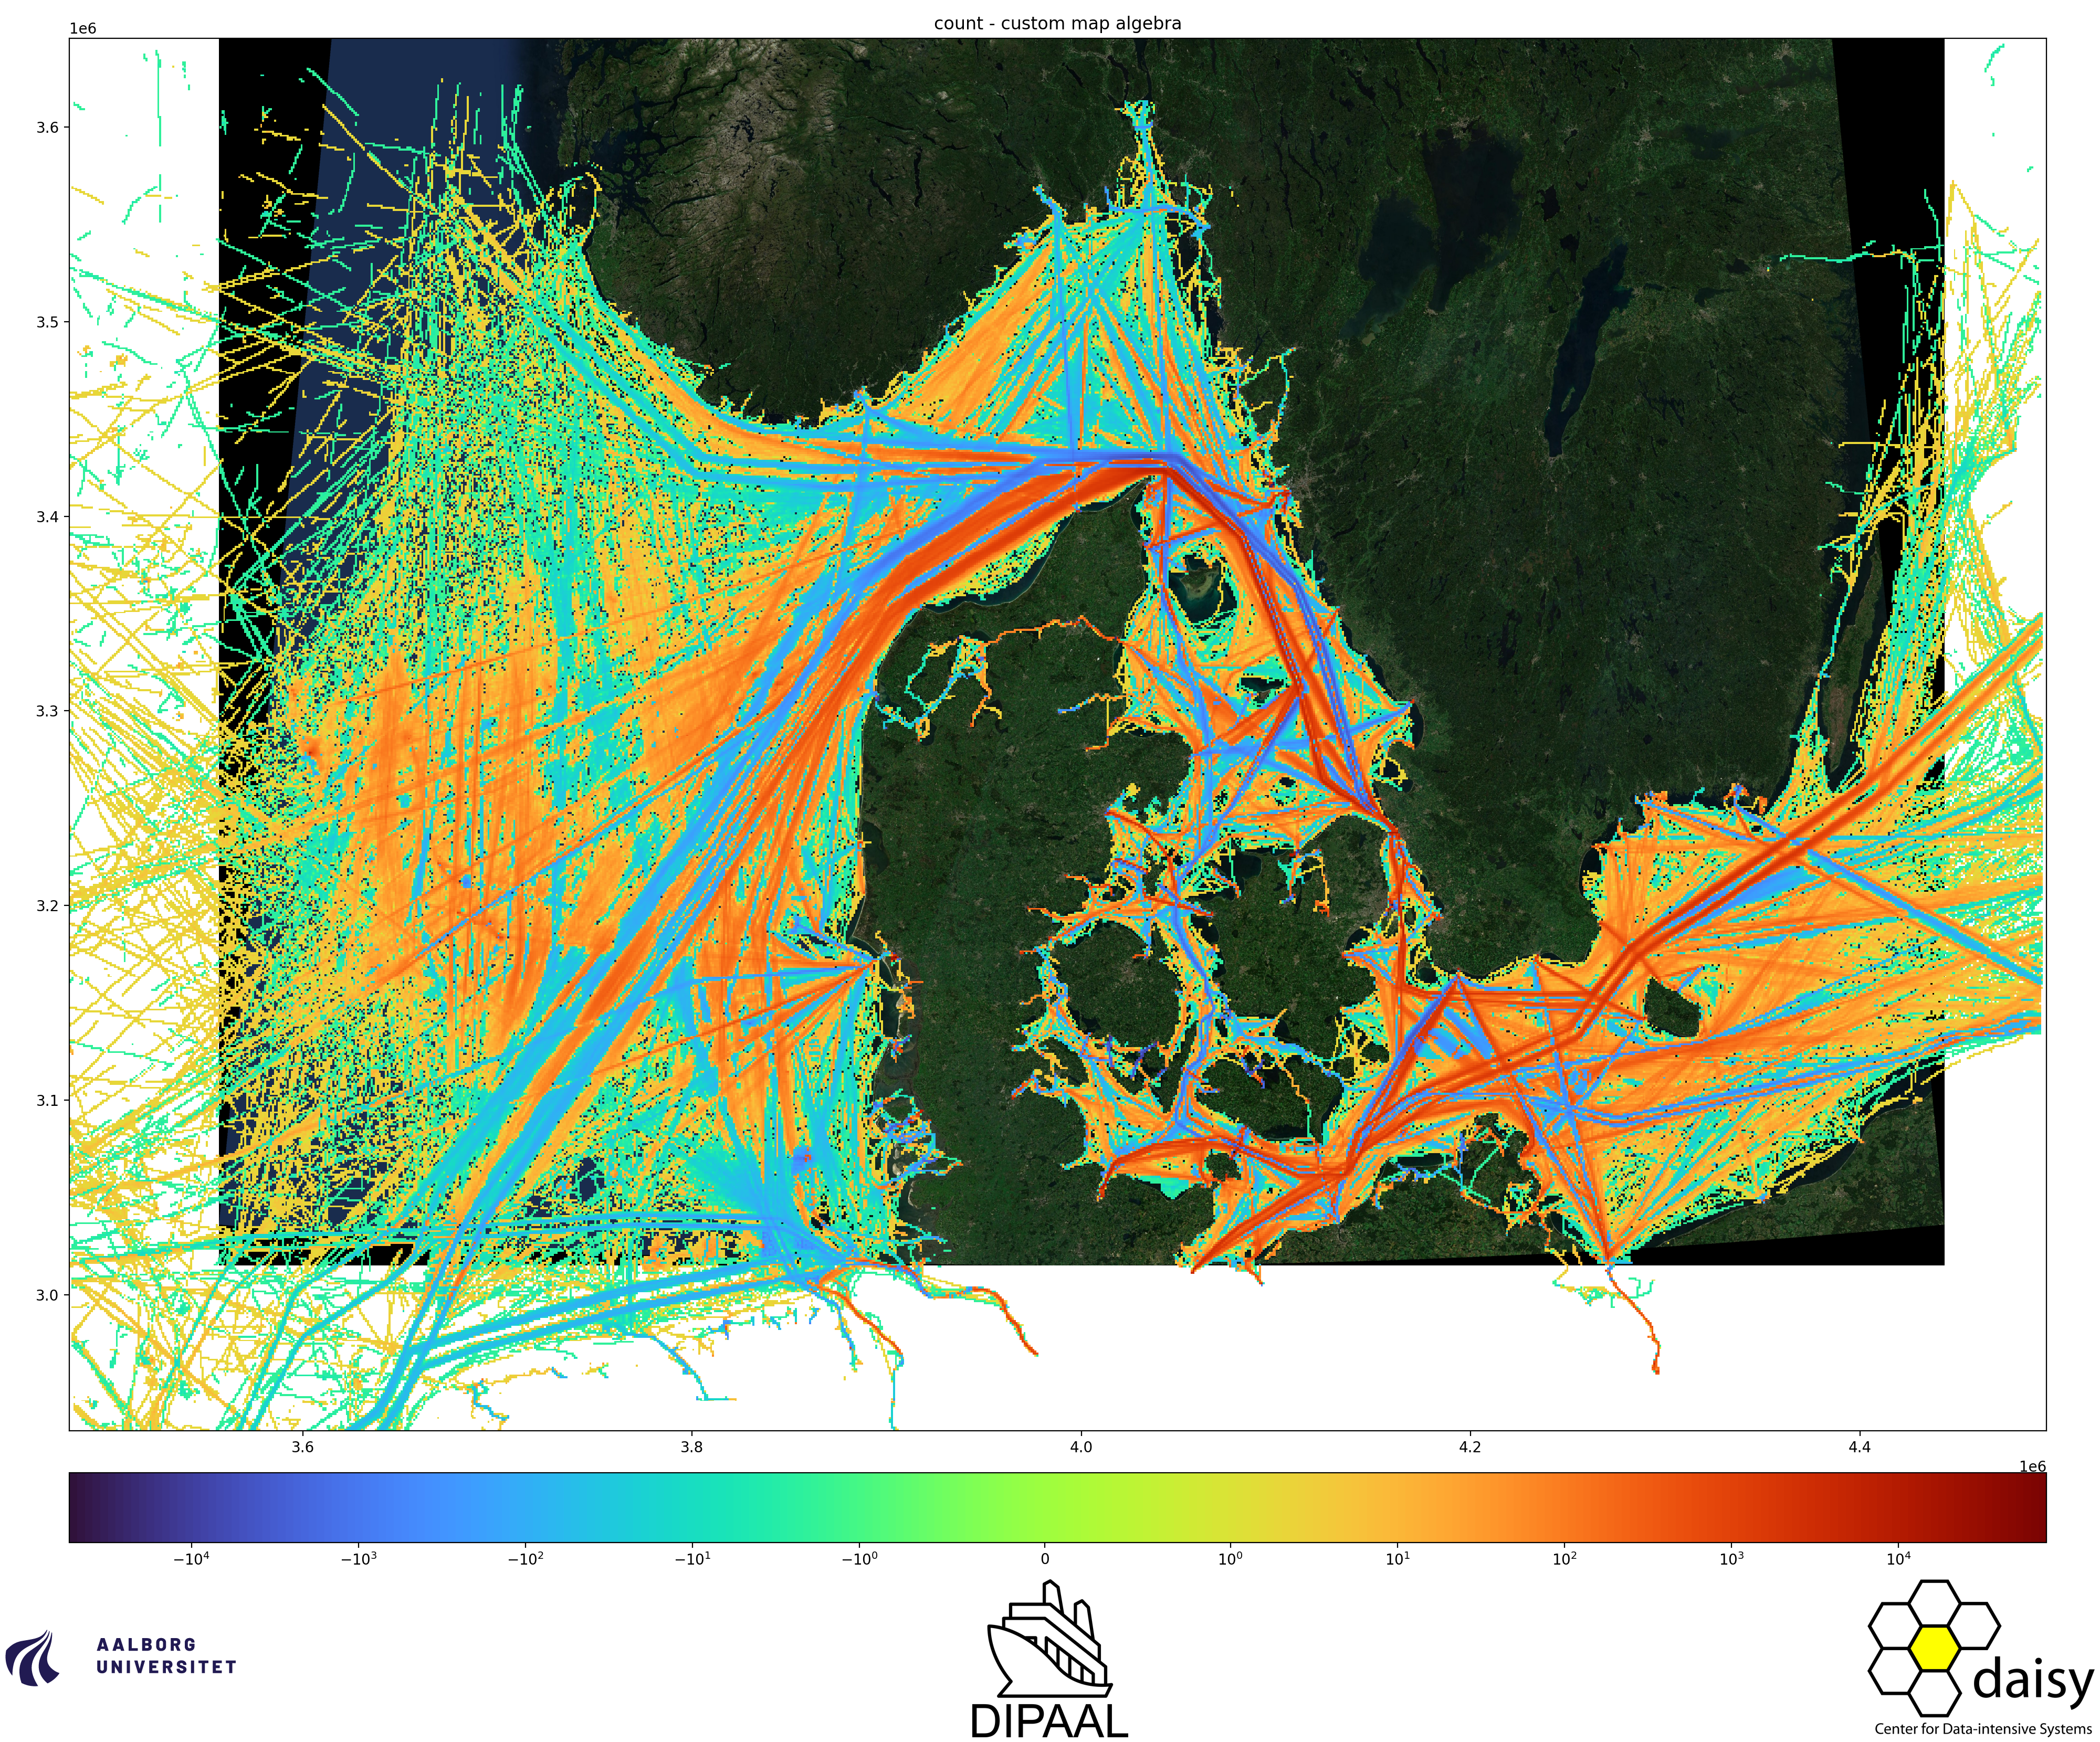
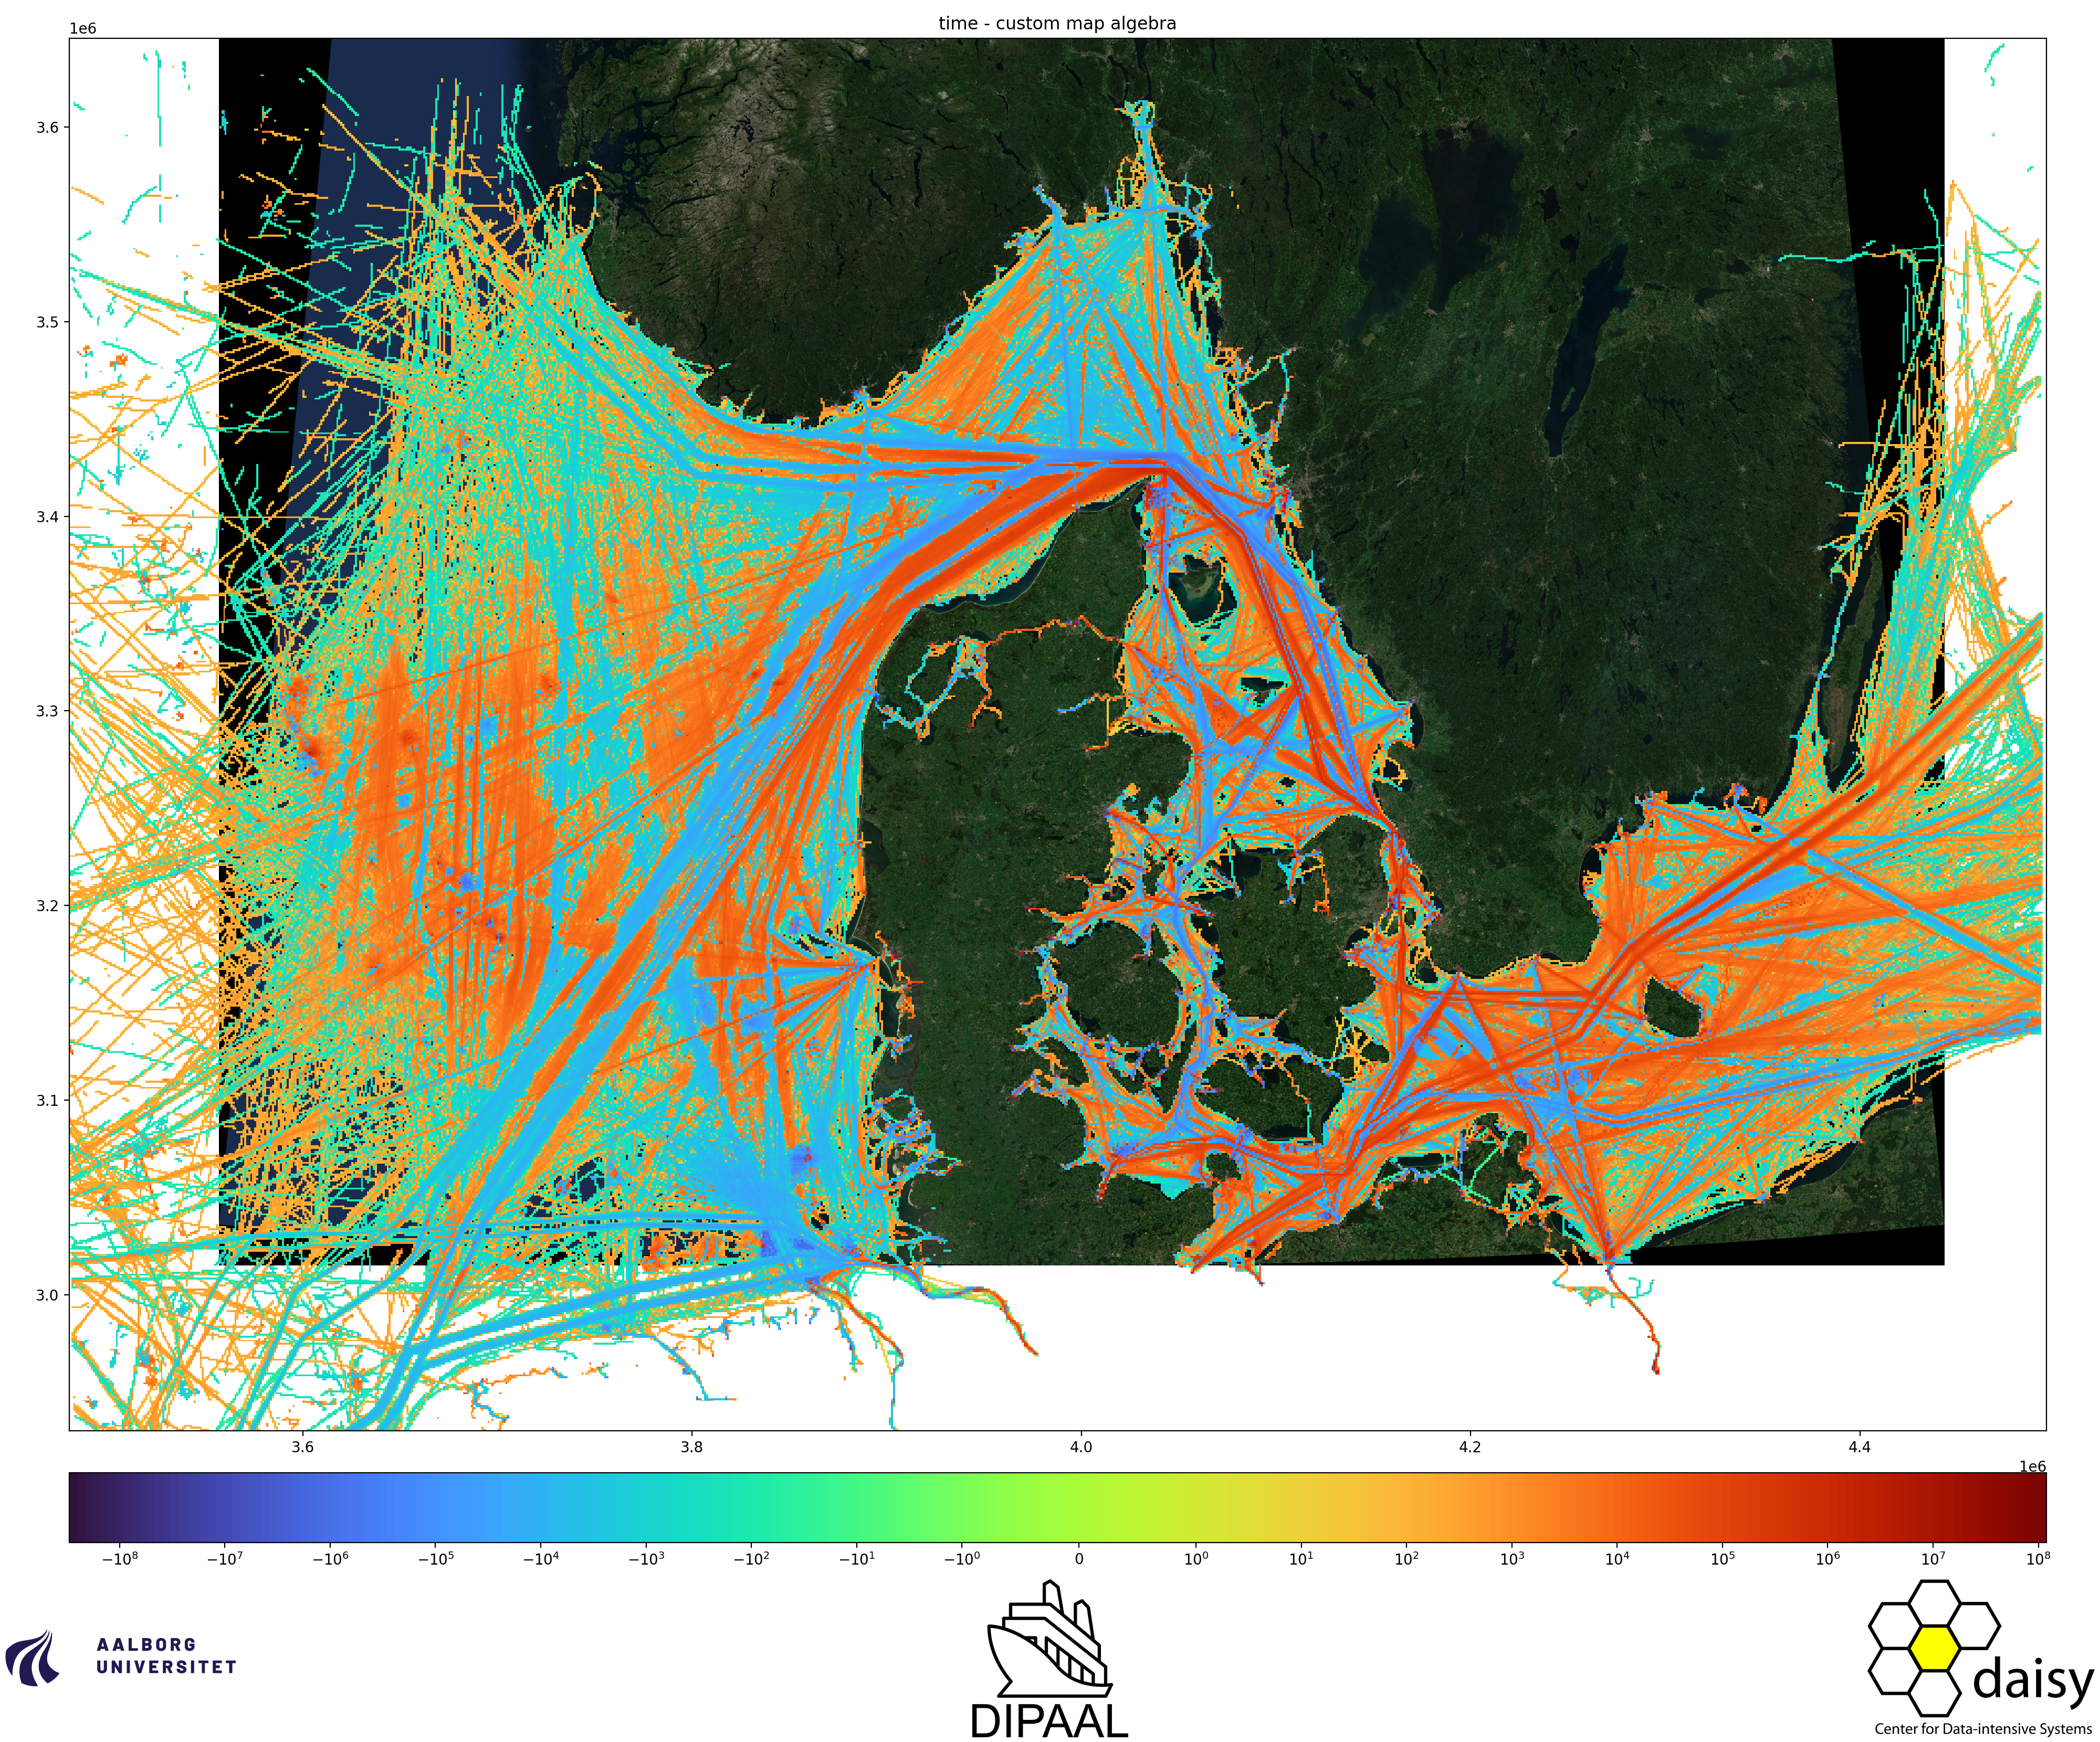
Cargo 2011 vs 2022
Using the MapAlgebra feature, these rasters show the difference between heatmaps of 2022 and 2011. Positive numbers indicate higher heat in 2022 than 2011, and vice versa.
Count heatmap
Unit is number of occurences.
Time heatmap
Unit is sum of time spent in the cell in seconds.
Video Animations
The API is capable of generating videos, combining multiple rasters.
Monthly Count Heatmap of 2022 - Class A ships only
Unit is number of occurences per month.
Monthly Count Heatmap of 2022 - Class B ships only
Unit is number of occurences per month.
Weekly Time Heatmap of 2021 - All ships
Unit is the sum of time spent in the cell in seconds.
Monthly Time Heatmap of 2019 - Fishing
Unit is the sum of time spent in the cell in seconds.
Monthly Delta Heading Heatmap of 2021 - Fishing
Unit is the average change in heading inside a cell in degrees.